The initial work with the isogram, controller run-time display,
chromatogram and UV-Vis absorbance display took about three months to
complete. The 3D graphics view was conceived, sold to marketing
& management, designed, and implemented within an additional seven
weeks. Of all the graphics and controls, the plots used for the
UV-Vis chromatogram were taken from an
existing common chromatogram display and control library previously
developed by another engineer with my collaboration. It should be
noted that this
common chromatogram display was a little bit of a compromise to
expedite the
project and help it fit in with other applications in the Varian
chromatography suite. Unfortunately, the existing chromatography
display and control
library had no way to flip the x-y plot by ninety degrees as is more
intuitive
for two orthogonal 2D projections from a 3D plot. The rest of the
controls and rendering were completely new. I did review, for
about one week, the option to use third party libraries such as
SiliconGraphics OpenGL and a Microsoft "vapor ware graphics library"
for
this 3D work. In the end, I opted to implement the projection
transformations myself, along with a interpolated
triangular fill, a grid and 3D control. When completed, the sales
and marketing were pleasantly surprised as they were used to a cruder
program
developed ten years prior.
All the plots are controls that may be adjusted by selecting, dragging,
right clicking. By holding the left mouse down in an isogram
window it will zoom in to finer detail (alt click to reverse out).
The color, b/w granularity, and isogram range can be set by
clicking on the isogram false
color scale. An optimized inner loop controls the
interpolation/extrapolation of the data to pixel transformation.
The Log space transformation is done with a quick little reverse
table so that on average just a little more than two double comparisons
per pixel instead of a floor(log(double)) computation.
The whole pixel plane is double buffered. A new scaled
pixel
map is redrawn with the appropriate portion of the old buffer data,
while
in a second thread recalculates the true pixel values occurs.
This rendering
algorithm (zoom and resize), works equally well with the run time
isogram,
producing several updates per second on a Pentium I class processor.
All the graphs can be printed or copied and pasted into applications
capable of displaying graphics. The isogram controller button can
be clicked to display its miniaturized isogram
in full size in the main program.
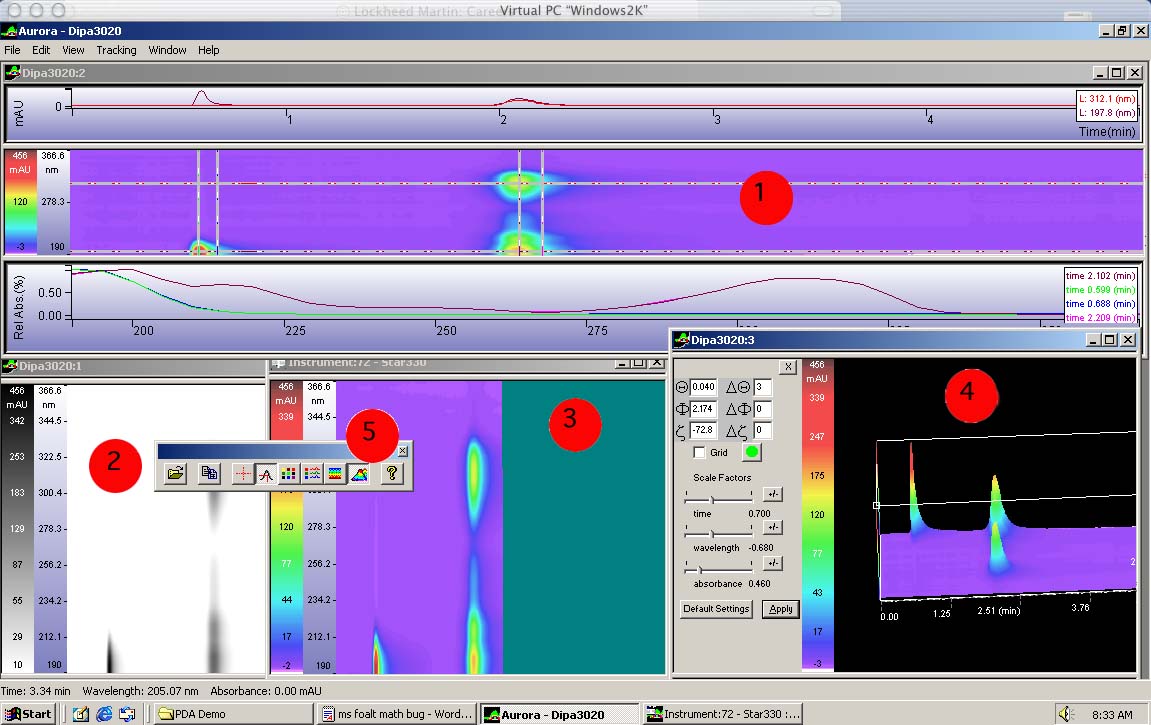
Captions
- This is the standard isogram view. It includes a wavelength
spectrum and a chromatograph at the current mouse position. Right
clicking will lay down (or delete) a new trace including a chromatogram
and/or spectrum at the clicked point. The background color and
trace colors may be selected
from a color palette.
- Here is another window (MFC concept) displaying the same isogram
data, this time in black and white mode.
- Another isogram displaying the same data, but this time it is
running through the acquisition simulator .
The isogram range and color specification can be changed by
clicking on the false color range control or remotely through the
acquisition software. Zooming and selecting/moving traces can be
done while the acquisition is occurring in real time.
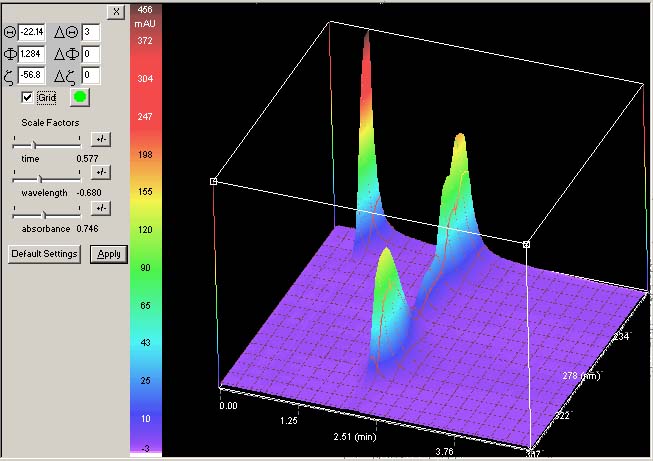
- The 3D plot can be manipulated in a fairly intuitive manner.
Just in case I still have the numerical values enter able for the
three axis (Phi, Theta, Gamma) and three scales (time, wavelength, and
absorbency). You cannot zoom in the 3D mode, but it graphs only
the isogram range when you pressed the 3D button. By going back
and forth one can select 3D graphing of the range of interest. See also enlargement below.
- A little tribute to the Microsoft Foundation Class. These
buttons change state with the views that they control.
Specifically the cross hair icon that controls the trace mode.
Tracing just the chromatogram, just the spectrum, or both (three
states instead of the usual two) is possible by pressing the button.
graphically displaying three states instead of two and a lot more
is possible with MFC if you didn't mind going deep into
the class structure source and either correcting or augmenting the
implementation.
Three Dimensional Viewing In this larger picture the grid almost works
properly. Having completed this 3D functionality with real world
data, I have a new appreciation for 3D plotting. The tricky part
about the grid it that it is supposed to
lie on the surface of the data and remain in good contrast with the
colors. I did fairly well with the colors, but really need to
anti-alias the grid lines. Otherwise, as we see here with the
breaks and absences
caused by noise in the data. I didn't want to give the grid its
own
channel (pixel plane), but this approach with anti-aliasing may be the
easiest
answer.
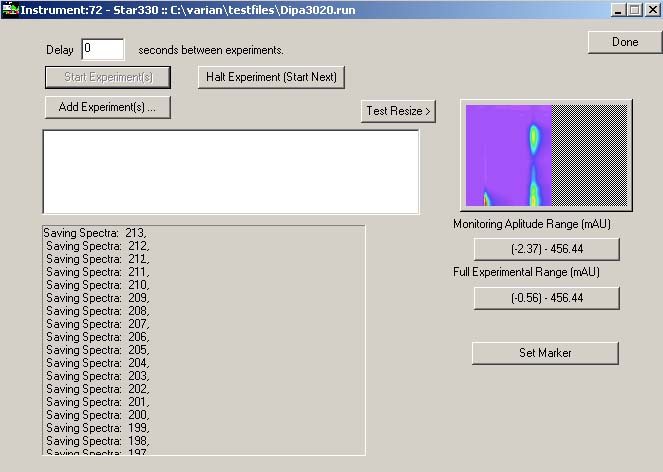
The Acquisition Simulator The larger graphical button (the isogram) on
the upper right has been embedded in the instrument driver software.
This test harness played back instrument runs to develop and test
the isogram button and communications between the driver and the Aurora
Application. In run time this button will update itself and
transmit the new data to an Aurora application. If pressed
it will start the Aurora application and/or display the current
acquisition
in full window mode. The Aurora application can display the real
time
data of up to two instruments (an arbitrary choice) and any number of
completed
experiments. Check it out, its not an error. The screen
capture
duplicated (sort of) the advancing "Saving Spectrum: 212" line.
Very
real time!